Title
Biodiversity data are sparse, biased and collected at many resolutions. So techniques are needed to combine these data and provide some clarity. This is where downscaling comes in. Downscaling predicts the occupancy of a species in a given area. That is, the number of grid squares a species is predicted to occupy in a standard grid of equally sized squares. Downscaling uses the intrinsic patterns in the spatial organization of an organism’s distributions to predict what the occupancy would be, given the occupancy at a coarser resolution.
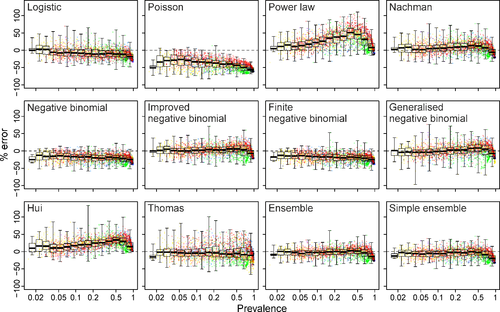
Groom et al. (2018) tests different downscaling models on birds and plants in four countries and in different landscapes and shows which models work best. The results show that all models work similarly, irrespective of the type of organism and landscape. However, some models were biased, either under- or overestimating occupancy. However, a few models were both reliable and unbiased. This means we can automate calculation of species occupancy. Workflows can harvest data from many sources and calculate species metrics in a timely manner, potentially delivering warnings so that interventions can be made.
Species invasions, habitat degradation and mass extinctions are not a future threat, they are happening now. Understanding how we should react, and what policies we need should be underpinned by solid evidence. Imagine if we had systems where we could monitor biodiversity just like we monitor the climate in easy to understand numbers that are both accurate and sensitive to change.
Groom QJ, Marsh CJ, Gavish Y, Kunin WE. (2018) How to predict fine resolution occupancy from coarse occupancy data. Methods Ecol Evol.;00:1–10. https://doi.org/10.1111/2041-210X.13078

Figure 1: Comparison of downscaling performance of difference mathematical models with the percentage error from the known distribution of breeding birds of Flanders. Points above the zero line are overestimates of occupancy and under the line are underestimates. The x-axis is the prevalence of the species in Flanders.


 RSS news
 Print this article
